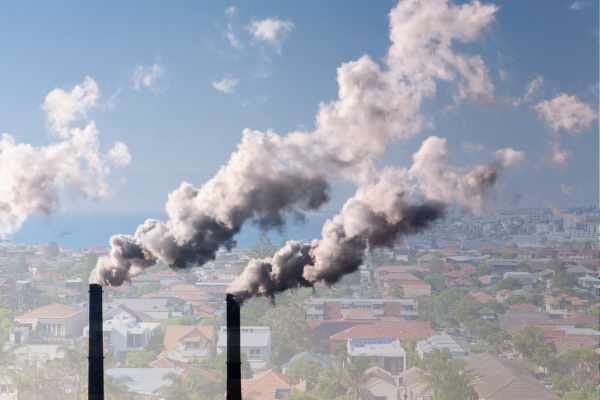
Pollution plumes float into view
A new visualisation tool helps urban communities identify the industrial sources of air pollution in their neighbourhood.

A new tool to track the flow of air pollution from high-emitting industrial sites into urban areas has been launched by Climate TRACE.
The global not-for-profit coalition of over 100 universities, researchers and data scientists, which was co-founded by climate campaigner Al Gore, began publishing monthly emissions data updates on key sectors in March this year.
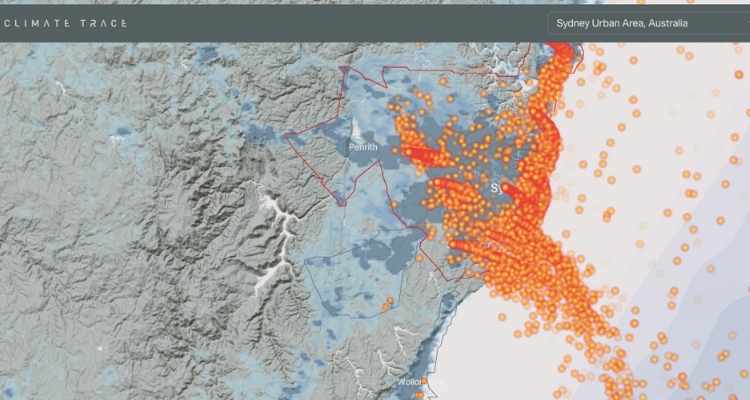
Climate TRACE's new open-access visualisation tool was released during Climate Week in New York City last month to reveal how sources of air pollution might be contributing to a public health crisis.
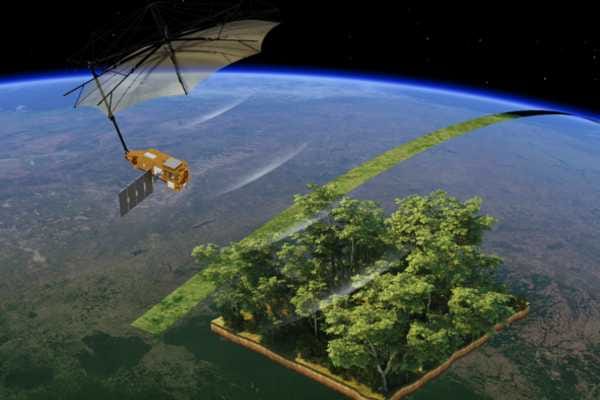
Using atmospheric modelling and satellite data, the tool tracks plumes of fine particulate matter, known as PM2.5 – a pollutant attributed to nearly nine million deaths globally each year, according to Climate TRACE.
Climate TRACE says it has mapped 9,560 sources of pollution across 2,572 cities worldwide to help users visualise how the microscopic pollutant can drift from its industrial source to the communities nearby.
“Facilities that burn fossil fuels are the overwhelmingly dominant source of heat-trapping pollution that is driving the climate crisis – by using the sky as if it were an open sewer,” Climate TRACE co-founder and former US Vice President Al Gore said.
"Facilities that burn fossil fuels are the overwhelmingly dominant source of heat-trapping pollution that is driving the climate crisis – by using the sky as if it were an open sewer."
PM2.5, which is released from various sources including fossil fuel-powered facilities such as power plants, ports, refineries and heavy manufacturing sites, can penetrate deep into human lungs and bloodstream according to health experts.
Air pollution, specifically PM2.5, is estimated to be responsible for more than 3200 deaths annually in Australia, according to figures published in 2021 by the Australian Institute of Health and Welfare.
Climate TRACE says the visualised data identifies stark global inequalities. In Karachi, over 18 million people are exposed to this pollution, with similarly high numbers in Guangzhou and Seoul.
“Many people have long known that they live in the shadow of major emitters,” Climate TRACE co-founder Gavin McCormick said. “But in other cases, dangerous pollution – and exactly who is causing it – can be surprisingly invisible.”
An eye on industry
Users of the tool can view two distinct pollution events per city: one representing average exposure conditions, and another for the worst recorded pollution day in 2024. These visualisations are overlaid with population data, highlighting where the health burden may be greatest.
Climate TRACE says the tool currently tracks and visualises pollution from five industrial sources commonly associated with PM2.5 emissions: power plants, ports, heavy manufacturing, refineries, and mines.
Over the coming year Climate TRACE says it will conduct a global analysis of all human-caused sources of PM2.5 pollution to identify where concentrations are highest, drilling down to the neighbourhood level.
By combining data from individual facilities with demographic and health information, it says it aims to pinpoint the communities facing the highest burden of pollution so "steps can be taken to reduce it".
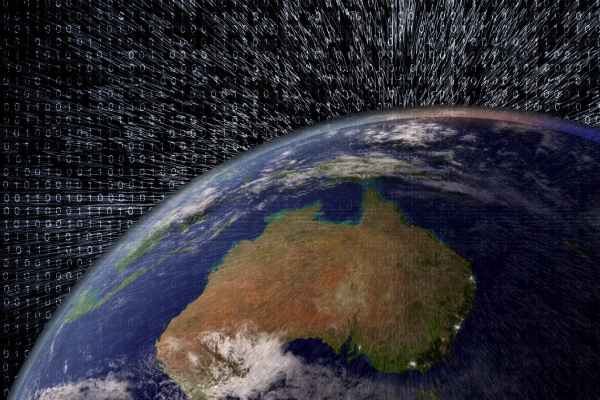
Climate TRACE says its new tool visualises the movement of PM2.5 air pollution from large industrial facilities into urban areas by combining its global inventory of satellite-based emissions data with a year’s worth of local weather modelling. The atmospheric modelling is conducted by Carnegie Mellon University’s CREATE Lab, while the emissions data is sourced from Climate TRACE’s global inventory of more than 660 million emission sources.
Related stories